K.K. DNAFORM
 |
|
|
|
| Quantify all RNA Polymerase II transcripts: |
|
|
|
|
CAGE: A unique transcriptome analysis method for 5’-ends of nc/mRNA
|
Cap Analysis of Gene Expression (CAGE) is a new method for expression profiling and promoter identification, which allows transcriptional network analysis and transcriptome characterization.
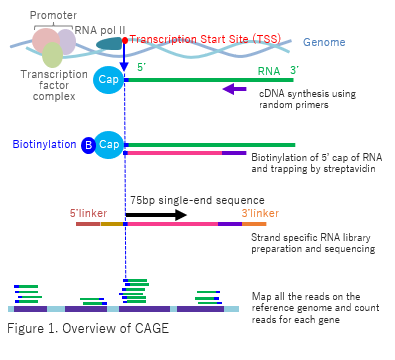
CAGE utilizes “cap-trapping” technology to capture the 5’ cap of mRNA/ncRNA. Through high volume parallel sequencing of cDNA corresponding to 5’-end of RNA and analysis of the sequenced tags, Transcription Start Sites (TSS) and transcript amount are inferred on a genome-wide scale (Fig. 1). The process of library preparation of CAGE use neither PCR nor fragmentation of RNA which cause biased results of the gene expression in RNA-seq. |

|
A powerful tool in gene regulation research
|
CAGE accurately identifies the position and expression level of TSS on a genome-wide scale with high repro-ducibility (Fig. 2).
The cap-trapping technology which captures one transcript with a 5’ cap as one read, and the PCR-free library preparation process without fragmentation allow for digital quantification of RNA transcript abundances including low expressed transcripts. CAGE detects precise position of TSS, which is extremely difficult for most transcriptomic technologies to identify (Fig. 3, and Table 1). Using information obtained by CAGE, such as precise positions, variants and transcript abundances of TSS, you can detect the corresponding promoters and accurately estimate signaling cascades. |

|
|
CAGE identifies complex gene expression networks
|
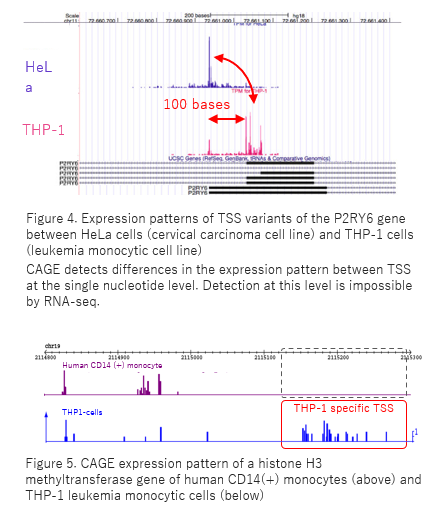
CAGE accurately provides information such as alternative TSS usage on a genome-wide scale (Fig. 4). CAGE is a powerful tool in gene expression network research.
Comparative analysis of promoter activity
Reliable estimation of promoter regions and their activities based on precise TSS information enable you to find alternative promoters and to compare promoter utilization patterns among different organs, developmental stages and diseased/normal organs which are essential in identifying expression networks underlying differentiation, development and diseases. CAGE also allows you to characterize type and genome-wide distribution of promoters (Carninci et al. 2006, Ohmiya et al. 2014).
Valuable tool in the development of new biomarkers of cancers and other diseases
CAGE detects TSS variants of mRNAs/ncRNAs, which vary in expression level and pattern depending on the type of cancer cells, diseased/normal organs (Fig. 5). TSS variants are valuable candidate of biomarkers even in the case that there are no difference at the transcript level.
Explore transcription factor binding motifs
CAGE enables you to explore transcription factor binding motifs. With CAGE, you can perform a genome-wide motif search around precise TSS positions which have different expression profiles depending on case and control (i.e. “up-regulated” or “down-regulated”) to obtain a list of candidates for transcription factor binding motifs which correspond to different expressions (Table 2).
The precise distance between each motif and TSS obtained by CAGE can verify estimations of associated transcription factors and enable you to find candidate genes that are regulated by specific transcription factors (Fig. 6). Non-coding RNA analysis
CAGE can be applied to detect and quantify long non-coding RNAs (lncRNAs), even those which are not polyadenylated. CAGE provides accurate information of the promoters and 5’-end sequence of the lncRNAs, which are difficult to determine by RNA-seq.
CAGE also enables you to identify active enhancers by detection of TSS of enhancer associated bidirectional RNAs (eRNAs). Enhancer identification by eRNAs is more precise than mapping analysis by ChIP-seq. |
 |
|||||||||||||||||||||||||||||
Table 2. Motif search near TSS with an expression level higher in preadipocytes than in mesenchymal stem cells
The known adipose differentiation marker, PPARγ, is detected. |
||||||||||||||||||||||||||||||
 |
How many TSS are present for each gene?
| Riken and the FANTOM consortium have identified more than 201,802 human TSS (Science 347, 2015), which is almost four times the number of known protein-coding genes and ncRNAs, using CAGE. More than half of all known genes are regulated by multiple alternative promoters. It is strongly indicated that many of these multiple promoters affect a tissue in a specific way and may be linked to specific diseases. |
|
|||||||||||||||||||||||||||||||||
Representative papers using CAGE
- Promoter-level transcriptome in primary lesions of endometrial cancer identified biomarkers associated with lymph node metastasis.
Yoshida E, et al. Sci. Rep. 2017 Oct 26;7:14160. doi: 10.1038/s41598-017-14418-5. - An atlas of human long non-coding RNAs with accurate 5’ ends.
Hon CC, et al. Nature. 2017 Mar 9;543(7644):199-204. doi: 10.1038/nature21374. - Single-Nucleotide Resolution Mapping of Hepatitis B Virus Promoters in Infected Human Livers and Hepatocellular Carcinoma.
Altinel K, et al. J Virol. 2016 Nov 14;90(23):10811-10822. - Reduced expression of APC-1B but not APC-1A by the deletion of promoter 1B is responsible for familial adenomatous polyposis.
Yamaguchi K, et al. Sci. Rep. 2016 May 24;6:26011. doi: 10.1038/srep26011. - Enhanced Identification of Transcriptional Enhancers Provides Mechanistic Insights into Diseases.
Murakawa Y, et al. Trends Genet. 2016 Feb;32(2):76-88. doi: 10.1016/j.tig.2015.11.004. - DeepCAGE Transcriptomics Reveal an Important Role of the Transcription Factor MAFB in the Lymphatic Endothelium.
Dieterich LC, et al. Cell Rep. 2015 Nov 17;13(7):1493-504 - Nuclear transcriptome profiling of induced pluripotent stem cells and embryonic stem cells identify non-coding loci resistant to reprogramming.
Fort A, et al. Cell Cycle. 2015;14(8):1148-55. doi: 10.4161/15384101.2014.988031. - Transcribed enhancers lead waves of coordinated transcription in transitioning mammalian cells.
Arner E, et al. Science 2015 Feb 27;347(6225):1010-4. doi126/science.1259418. - Deep transcriptome profiling of mammalian stem cells supports a regulatory role for retrotransposons in pluripotency maintenance Fort A, et al. Nat. Genet. 2014 Jun 28;46:558-566. doi:10.1038/ng.2965.
- Two independent transcription initiation codes overlap on vertebrate core promoters.
Haberle V, et al. Nature 2014 Mar 20; 507(7492):381-385. doi: 10.1038/nature12974. - Tiny RNAs associated with transcription start sites in animals.
Taft RJ, et al. Nat. Gen. 2009 Apr 19;41(5): 572-578. doi:10.1038/ng.312.
Project workflow
| 1. | Total RNA submission |
2. | Library preparation/ Sequences |
3. | Bioinformatics analysis |
 |
||||||||||||||||||||||||
|---|---|---|---|---|---|---|---|---|---|---|---|---|---|---|---|---|---|---|---|---|---|---|---|---|---|---|---|---|---|---|
|
|
|
||||||||||||||||||||||||||||
Ordering information
|
|
|||||||||||||||||||||||
 |
K.K. DNAFORM
Ask Sanshin Building 3F, 2-6-29 Tsurumi-chuo, Tsurumi-ku, Yokohama, Kanagawa 230-0051 Japan
TEL: +81-45-508-1539 FAX: +81-45-510-0608 E-mail: contact@dnaform.jp |
 |